
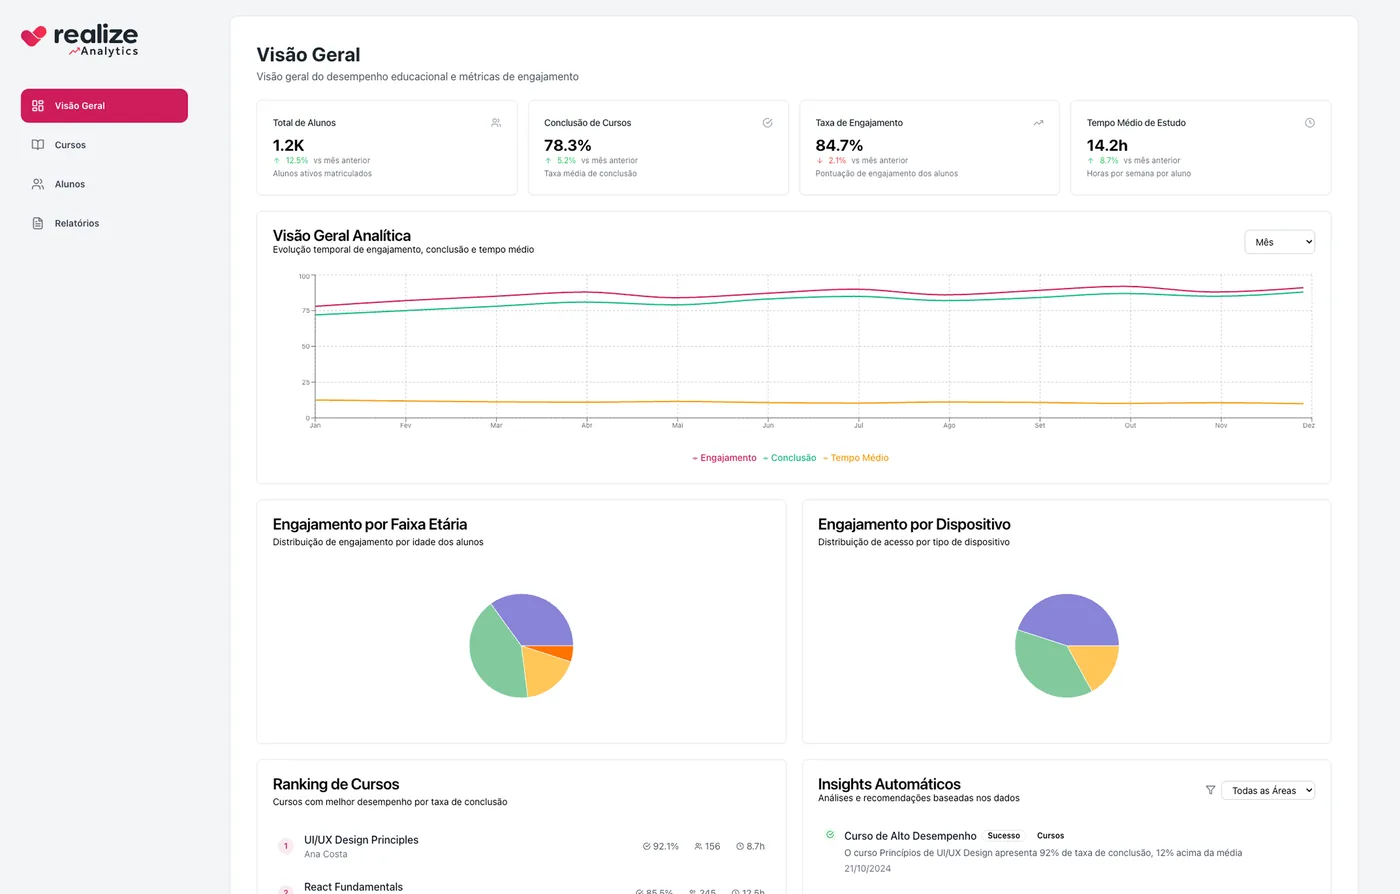
- Role
- Senior Product Designer
- Client
- Realize
- Year
- 2024
- Areas
- Product design, Data visualization
Context
Educational institutions collect data on students, courses and visits, but these numbers rarely become decisions. Coordinators needed to see quickly what was going well and what needed attention.
The problem
Plenty of data, too few answers: the numbers were there, but they did not say where to act.
- 01
Metrics without comparison did not show whether things had improved or got worse.
- 02
Drops in engagement were noticed late, when the student had already given up.
- 03
Going from institution to course to student meant building separate analyses.
How I solved it[03]
- 01
Four numbers on top, always compared
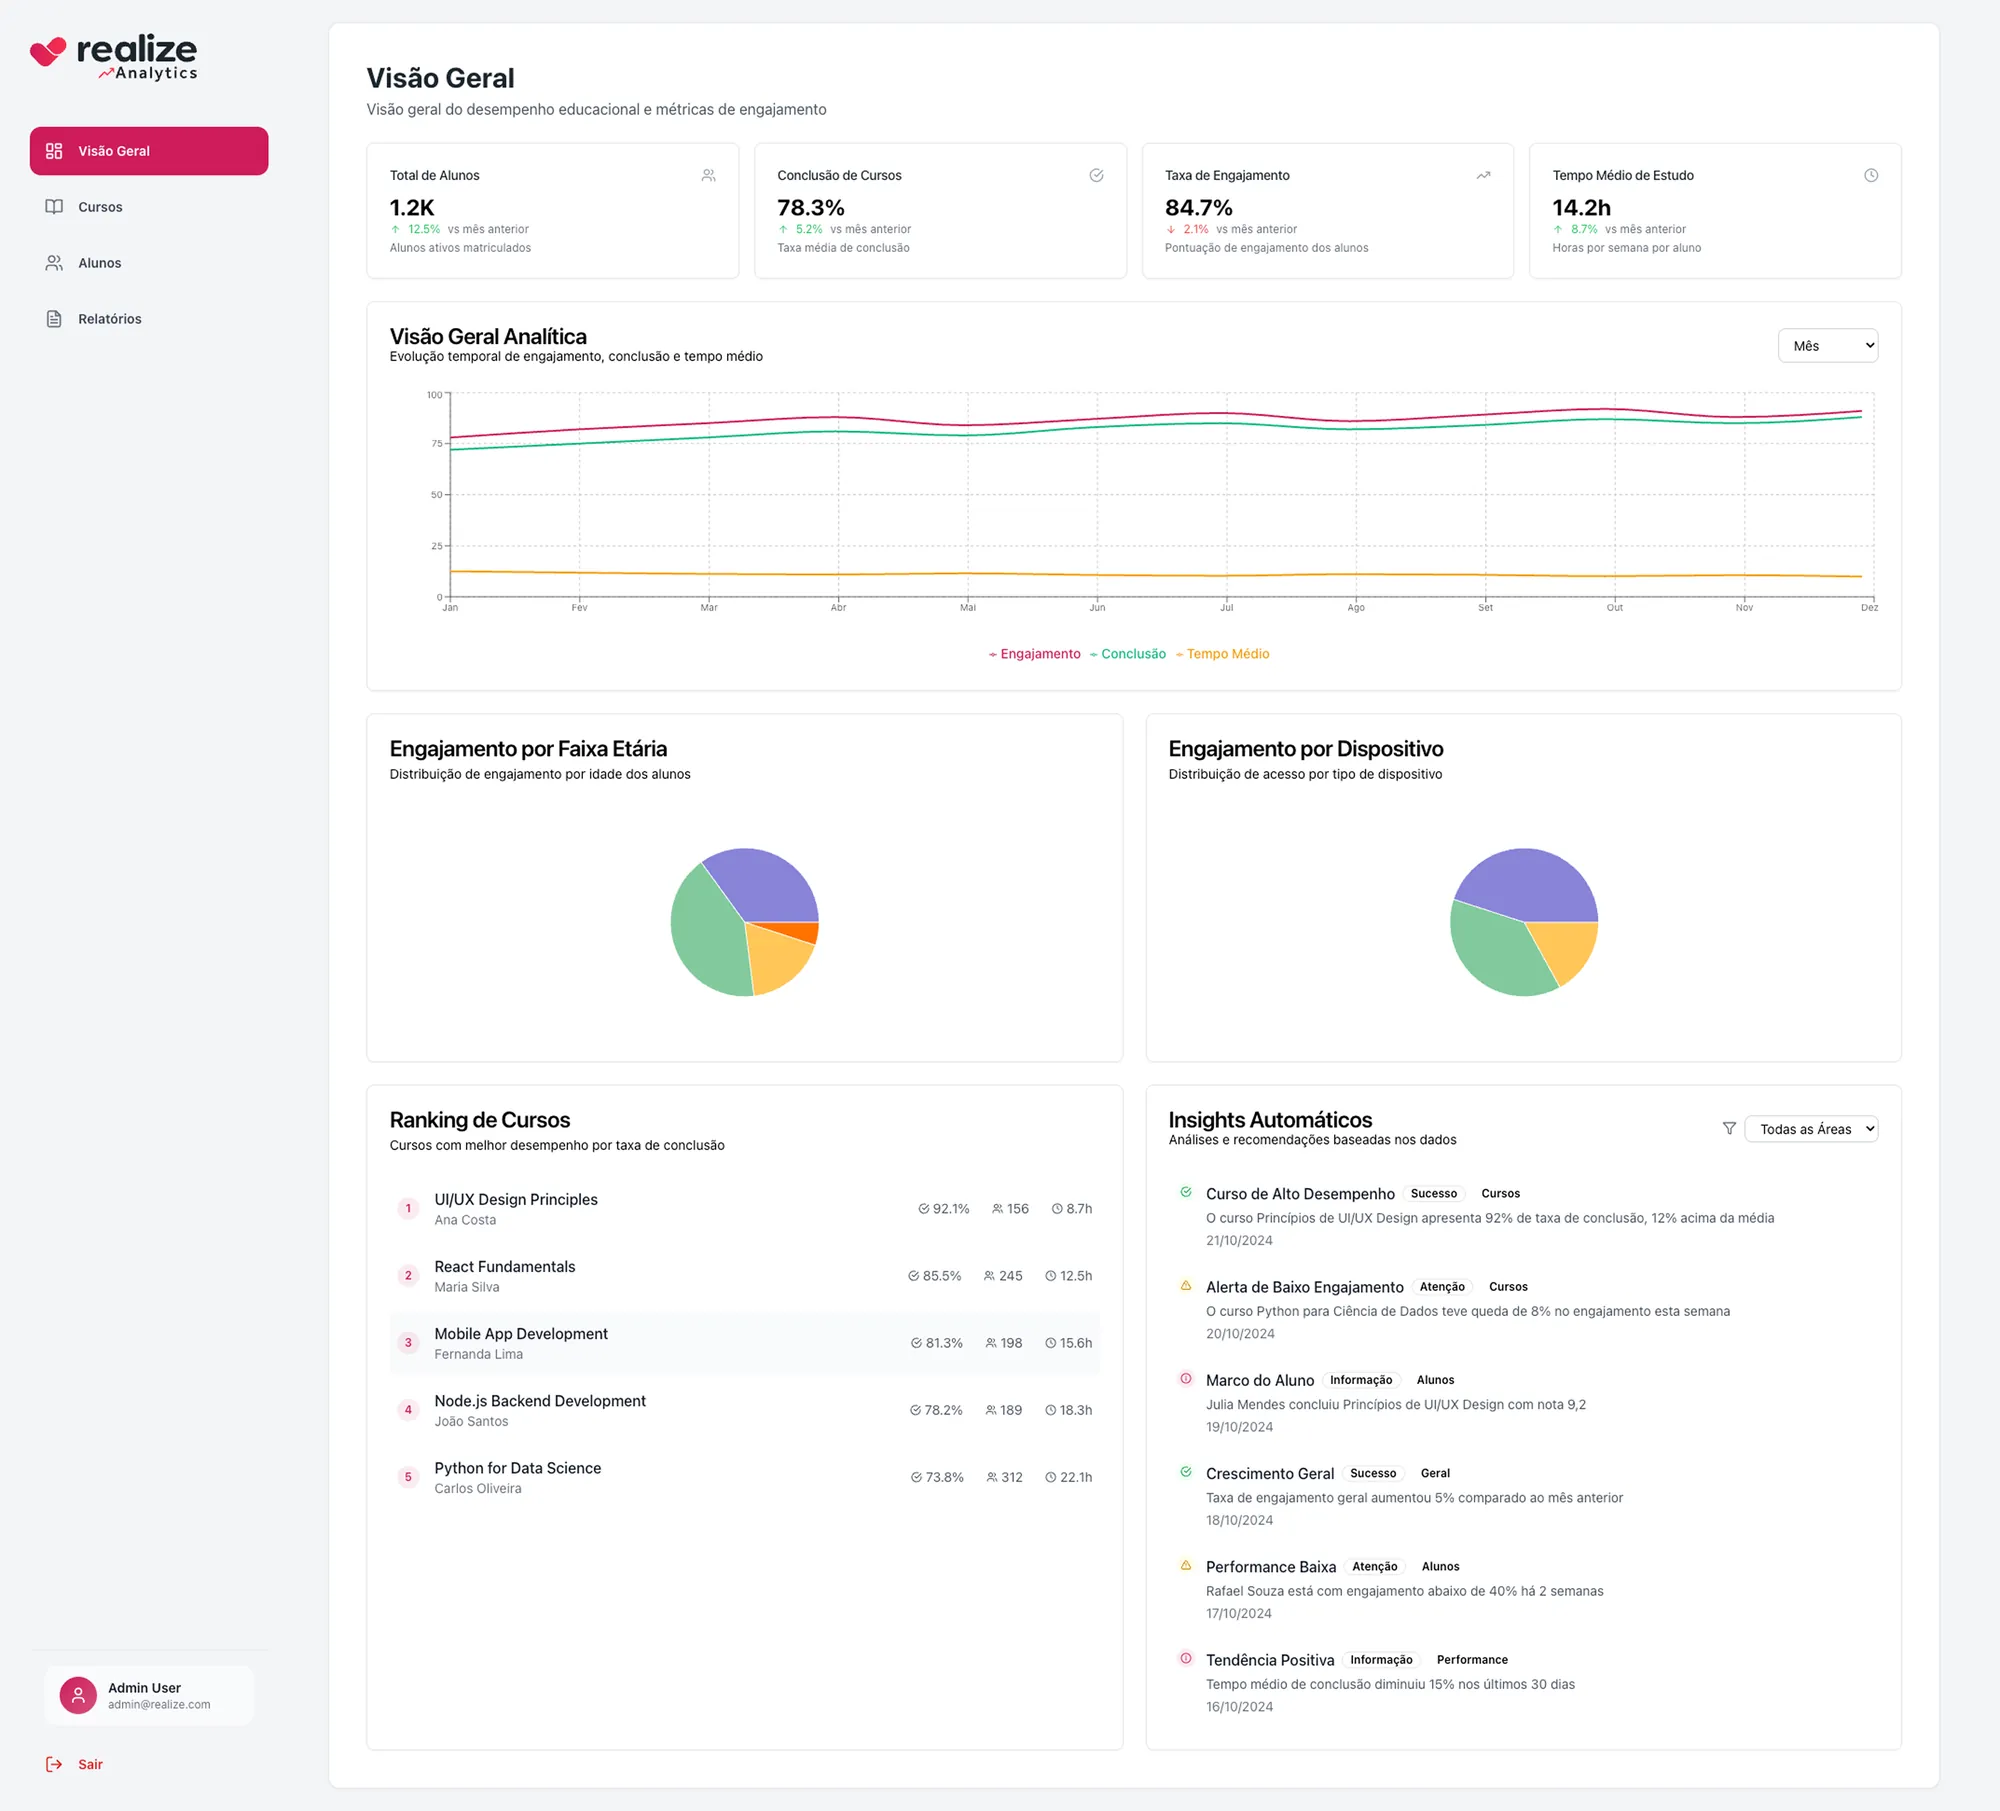
Total students, completion, engagement and average study time show the change from the previous month. In seconds you know whether things got better.
- 02
Three levels of zoom
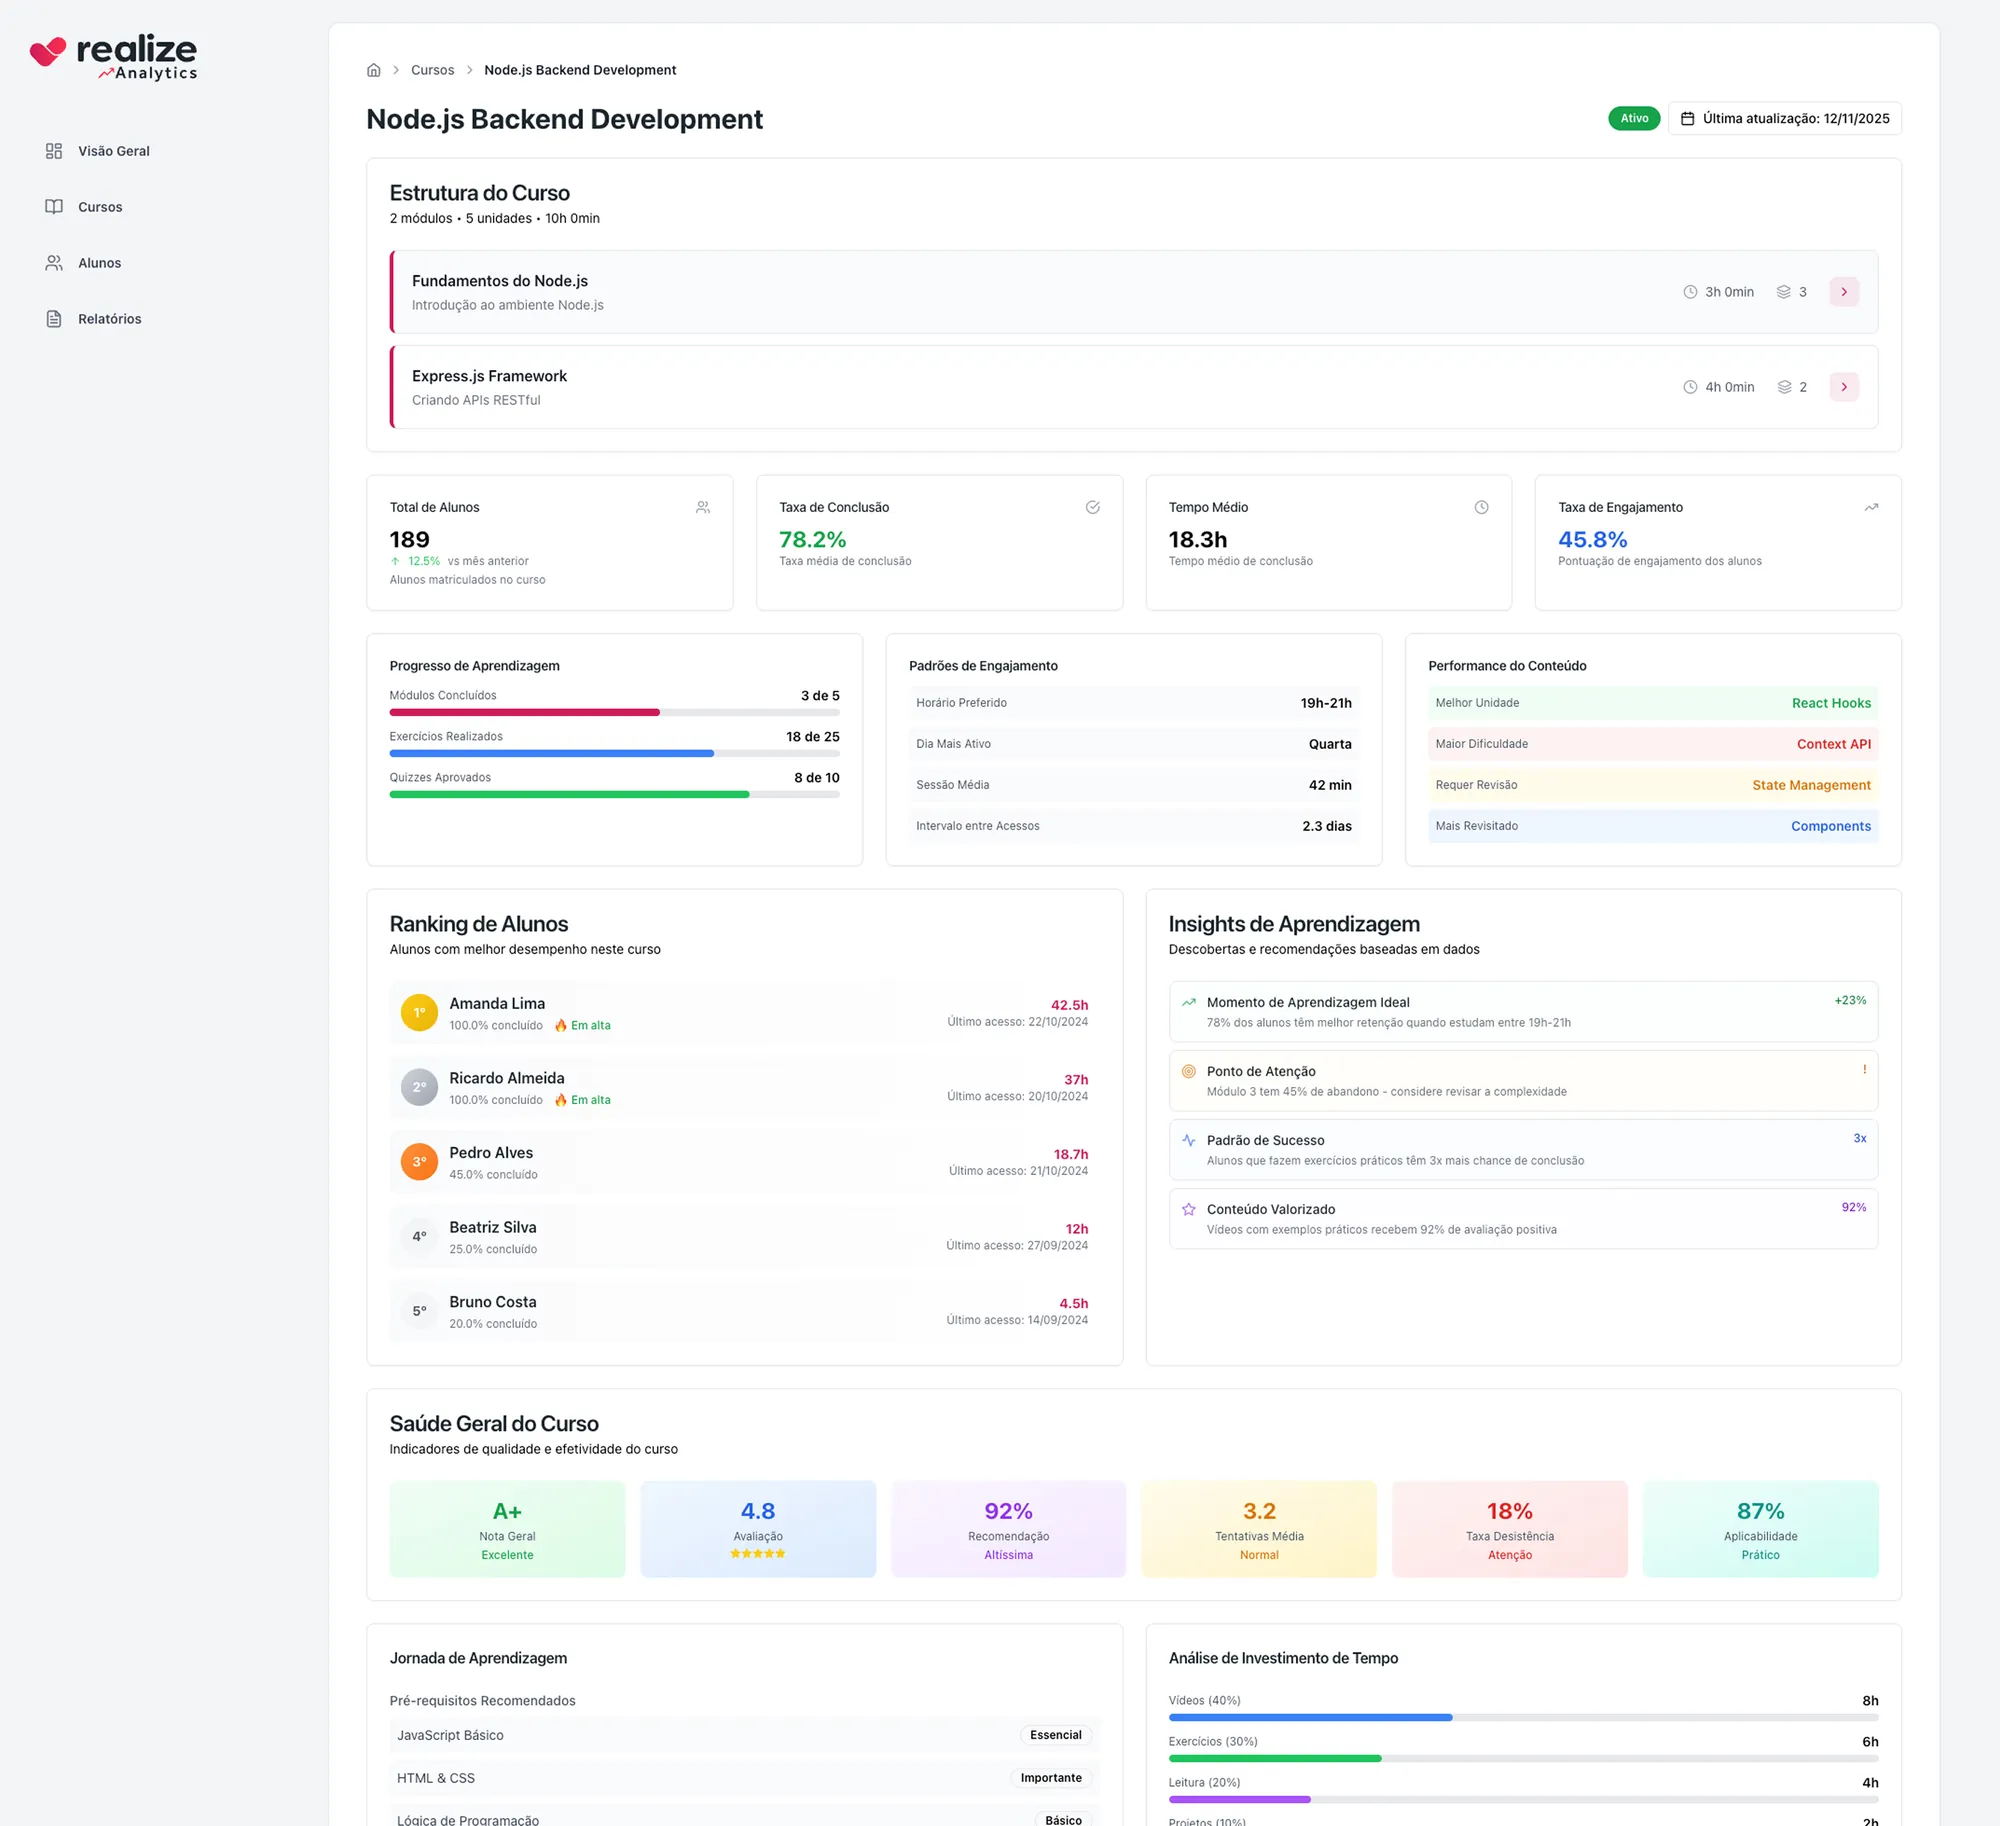
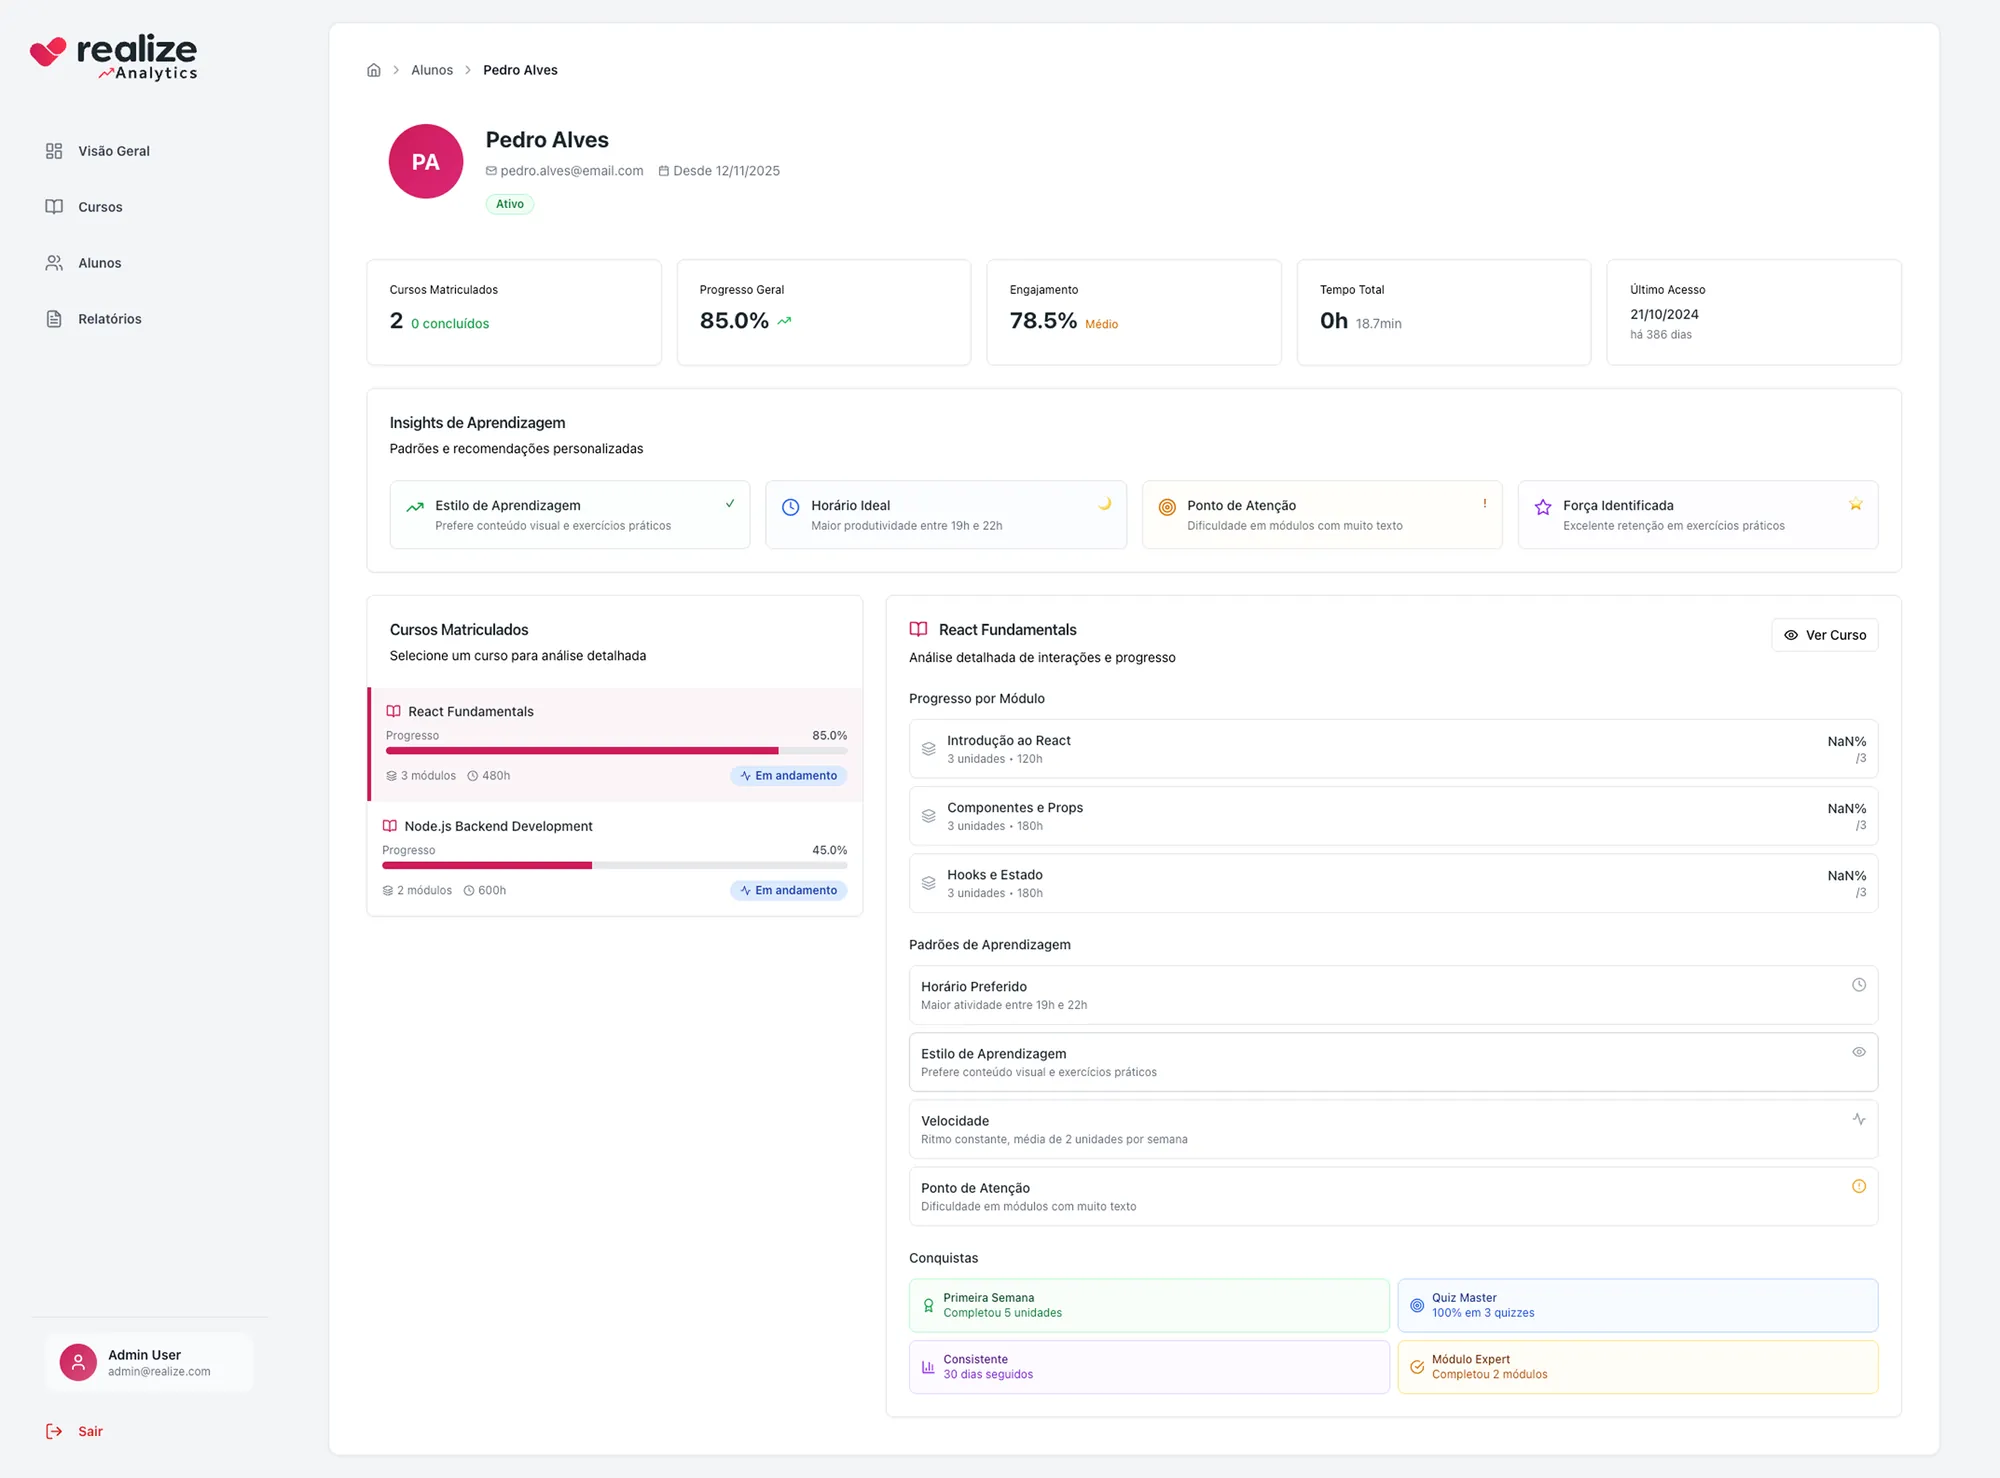
From the institution overview to the course, and from the course to the student, with the same logic at each level. The question changes; the way of reading stays the same.
- 03
Insights that lead to action
Automatic insights sort what they find into success, attention and information, with a filter by area. The dashboard points to where to act, like a module with high drop-off or a student whose engagement is falling.
Screens[03]
Outcome
Coordinators go from number to action on the same screen: the dashboard shows what improved, what got worse and where to look first.
What I learned
In dashboards, design lives more in hierarchy than in charts. Deciding what to leave out was the most important choice.
Next project
Style customizer
Realize · 2024